


Seeing our partners thrive by implementing our solutions fills us with satisfaction. Today, we are pleased to share the inspiring testimonial of Freddy Araque, Co-Founder of Ebitda Group.
The company, comprised of professionals with extensive experience in countries such as Peru, Chile, Argentina, Bolivia, Paraguay, Brazil, Colombia, and Mexico, is headquartered in Quito and has a client network that extends beyond the borders of Ecuador. See what Freddy Araque says about our partnership:

“The strategic alliance we maintain with MyABCM has allowed us to stay ahead of the regional competition regarding Cost, Profitability, and Performance Management. Its specialized technology has facilitated the support of our clients in their efforts to assess, quantify, and execute strategies, allowing for consideration of historical trends and fostering future projections.
The different business sectors in which we have carried out joint implementations have experienced a transformation of their cost, expenditure, and indicator information, which have become true management insights that support decision-making. Without a doubt, the future of finance is connected to Industry 4.0 through agile processes, use of analysis, and integration of financial, commercial, operational, and administrative information sources and, for these challenges, we see MyABCM as the ideal technology to combine the best practices related to Performance Management.”
This testimony reinforces that, together, we have transformed the cost, expense, and indicator information of the various business sectors into real management insights that support strategic decision-making. And the support of partners like Ebitda Group is indispensable in this process. Through this partnership, we have brought about a notable change in the ability of more organizations to understand and use their data to drive their business growth.
We are committed to working closely with Ebitda Group and other partners to drive our customers’ business transformation, providing innovative solutions, exceptional support, and real results. Together, we are prepared to face the challenges of the modern business world and embrace the opportunities of the digital era.
Parametrus, a Brazilian company based in Porto Alegre, with a global reach, is a Platinum Partner with over a decade of work alongside us and has been a key player in the marketing of our solutions. Through this collaboration, customers from multiple segments and of varying sizes chart their strategies and make decisions based on accurate cost and profitability information generated by our solutions.
With access to advanced resources, these companies can solidify their presence in the current highly competitive business environment. The accurate information on costs and profitability provided by MyABCM solutions, with the technical support of Parametrus, allows organizations to make managerial and operational decisions assertively, in addition to enabling the implementation of actions to maximize profits, expanding their competitive advantage.
Therefore, we are very happy to share the testimony of Rodrigo Campagnolo, Managing Partner at the helm of this valuable partner:

“We have been partners of MyABCM for over 10 years and the use of its solutions has allowed us to model complex cost and profitability management systems, capable of adapting to the operational reality of any company. The tool allows us to use different costing methods, according to the operational needs of each company, consolidating everything into an integrated model for analysis and decision-making. In addition to this, the competence and dedication of the MyABCM team facilitates our work and helps us to ensure customer satisfaction.”
With the support of Parametrus, we have taken our solutions to more customers and new market segments, always delivering together expertise in cost and profitability management and a differentiated service. As a result of this collaboration, year after year we share knowledge, strategies, and of course: a lot of growth!
We are proud to be part of this journey of success and we reaffirm our commitment to continue providing innovative solutions and exceptional support for Parametrus, its customers, and all of our partners.
There are many challenges to pricing BPO services, as the outsourcing company practically absorbs its clients’ costs with the promise of reducing them. This is why it is essential for BPO companies to be able to visualize and properly control their own internal costs.
Especially because it’s an industry with few entry barriers, where competitiveness tends to grow. In such cases, the tendency of organizations in the sector to resort to low prices as a competitive tool must be resisted. Incorrect pricing, neglecting cost information, makes BPO companies highly vulnerable to financial difficulties and compromises the quality of the services provided.
Many management challenges lead companies to adopt cost-cutting measures. In this scenario, costs are generally selected on fronts that supposedly don’t deliver direct value to service users, in an attempt to reduce the impact of these cuts.
However, what we observe in practice is that this analysis is often done incorrectly when not well supported by management models suitable for the activities performed. Therefore, regardless of their niche of specialization, companies that provide BPO services need to implement cost management tools to ensure that their rates are set correctly and to avoid damaging the service when the need arises to reduce costs.
It is essential to establish standards capable of identifying the different costs related to each of the organization’s activities, and then allocate them properly and set prices for the services offered based on the resources they consume. In this way, it is possible to price the BPO service with adequate profit margins and maintain the company’s financial health.
The costs of a business can vary significantly, even within the same sector. However, for didactic purposes, we will illustrate below some of the main costs involved in the operations of a Financial BPO company.
The cost of physical space depends on several factors, such as location, the number of workstations (and the space required for each one), and decompression areas, restrooms, among others. All these factors must be considered as cost generators and the impact of each one on the quality of service provision must be assessed in order to understand when it is possible to reduce costs on this front and when it is worth investing in this sector, even if the relative costs increase.
In the case of organizations working with a remote model, it is necessary to observe the costs generated on other fronts, such as technology, staff allowances, etc.
We present energy costs separately from other infrastructure-related costs because they can be substantial and often offer opportunities for reduction. Depending on the number of employees and workstations, as well as the type of equipment used, energy costs can vary significantly.
Financial BPO companies must pay attention to personnel costs. The activities of each department or customer service cell must have their employee costs carefully tracked, especially since the workforce required to provide a service, when underestimated, leads to a drop in productivity that impacts the profitability of the business.
Here, it is worth noting the importance of listing all the costs of labor obligations, which extend far beyond the monthly salary. Training, vacations, Christmas bonus, benefits, taxes and bonuses need to be accounted for properly so as not to affect the pricing of services.
In this context, it is necessary to establish methods for monitoring productivity and properly estimating the size of the team, so as not to waste resources or underestimate the workforce needed to deliver quality services.
Technology costs can be some of the most difficult to measure and control, as they are not limited to the initial investment in equipment, but also its maintenance, replacement, upgrades, etc. It is also necessary to account for the costs of the software used in the organization’s activities, as well as making the correct relationship between technology costs when assessing the possibility of expanding the team, for example.
Indirect costs are some of the most challenging for organizations because they don’t have such an explicit relationship with the company’s activities. However, tracking and allocating them correctly can be the difference between a profitable or loss-making service for the organization.
Learn more about overhead management!
Here you have seen in general terms some of the main costs to be taken into account when pricing BPO services. However, it is important to note that each organization will have different cost drivers, depending on the various activities carried out internally.
Therefore, correct pricing for BPO, with a guarantee of profitable margins, depends on the application of studies to understand how your organization, with its specificities, applies resources to different activities and services.
Do you need expert help identifying costs and pricing your BPO services? Fill in the form and talk to our team!
Almost 30 years ago, in February 1997, the main headline of Forbes Magazine featured an article by Prof. Srikumar S. Rao from Columbia University, which showed that the lack of control over rising indirect costs could bring organizations to an end.
In the article, Prof. Srikumar cited the real example of a giant American company that found a growth opportunity with the bankruptcy of its main competitor. However, contrary to what it expected, it started making losses instead of increased profits!
Upon further investigation, this company surprisingly discovered that its “flagship” product was unprofitable, and other products it considered unprofitable were, in fact, the most profitable ones for the organization. This happened due to a poor allocation of indirect costs.
How could such a large and intelligent company make such a basic mistake? It was revealed that the organization was allocating depreciation and other indirect costs based on the direct labor cost.
A product that consumed 20% of direct labor also ended up taking 20% of depreciation and overhead costs. However, there was a major flaw here: labor doesn’t depreciate, machines do.
In areas where there is high labor consumption, less machinery is usually required. The moral of the story: products that consumed a lot of labor should have received less depreciation and overhead costs – exactly the opposite of what was calculated.
The danger lies in the fact that direct costs are easy to appropriate: it’s straightforward to know, for example, how much raw material is used in a product or how much cash is in a specific bank account. But what about indirect costs? How do we allocate them correctly and coherently, respecting a cause-and-effect relationship?
A failure in this process, in the medium and long term, is often the cause of business ruin. Improperly allocated indirect costs can be detrimental to your business.
It’s crucial to exercise caution with any cost modeling that mechanically allocates indirect costs.
And remember: depreciation is just one of many indirect items! Indirect costs can include everything from toilet paper in the bathroom to IT, HR, and support area costs. The “lazy” solution is to allocate them proportionally to production volumes, transactions, or revenue.
To complicate matters, these indirect costs are becoming more significant for several reasons. Among them, we can mention an increase in automation, which entails a clear “replacement of people with machines.” Additionally, the growing diversity of products, services, customers, channels, suppliers, and machinery (i.e., increased business complexity) results in higher indirect costs due to the increased administrative effort – the management effort needed to handle this complexity.
Historically, these indirect costs only increase. Consequently, the distortions caused by arbitrary apportionment also increase. It is common to find situations in companies where a product, believed to be the “flagship,” is unprofitable. On the other hand, products considered unattractive are often the most profitable for the company, responsible for maintaining the company’s margins in the black.
Imagine three friends decide to go out for dinner. The first one is on a diet and orders a salad with mineral water. The second friend orders a delicious steak with wine, and the third orders lobster with sparkling wine and dessert. At the end of the dinner, they split the bill equally among the three friends.
Does this splitting seem fair to you? It is easy to identify and even find these distortions absurd. However, these distortions happen every day in many companies worldwide!
Now, if you were to ask for separate bills for each friend, where each one pays only for what they consumed, we’re talking about ABC, “activity-based costing,” which potentially eliminates these distortions in organizations and adequately addresses these indirect costs.
With some practical examples, it’s easier to visualize the weight of indirect costs and understand how activity-based costing allows us to identify and allocate them more accurately.
Take a simple billing activity: its total cost consists of the combined salaries and benefits of the people involved in this activity.
Traditionally, this total cost would have gone into a pool of “general expenses” to be arbitrarily allocated. However, with ABC, you divide this value by a non-financial measure, such as the number of invoices generated Thus, you obtain the cost per invoice. Count the number of invoices generated per product, multiply by this value, and allocate it to each product – this is the value of the “Billing” activity for each of your products. In addition to eliminating distortions, we achieve an important KPI (key performance indicator) for business management: the value of invoicing per issued invoice.
With this data, cost reduction studies, possibilities for outsourcing, and even monthly monitoring can be applied – something that simply would not be possible before activity-based costing.
The cost of this activity relates to the HR department’s effort specifically involved in hiring employees. It must be separated from other activities, such as payroll processing, employee evaluations, training, etc.
Suppose that, in a given period, 10 people were hired. Out of these, 5 were for Production, 2 for Maintenance, and 3 for Sales. Therefore, the costs of this “Employee Hiring” activity should be distributed as follows: 50% to Production (which will subsequently be allocated to products, also by activities), 20% to Maintenance, and 30% to Sales.
Apart from being able to allocate the costs of this activity, we obtain a critical KPI for decision-making: the cost of hiring per employee – this value can be compared with the monthly expenses of the previous months, the company’s target, or even the cost of outsourcing this activity.
The potential here is not limited to indirect costs! Several direct costs, for example, production or customer service costs, can (and should!) be broken down by activities, as we will see in the examples below:
Imagine you work in a manufacturing company and have been tasked with cutting costs by 10%. What would you do?
The natural path here is to try to understand which actions you would implement for this cut, and for this, it is essential to understand how costs are currently distributed.
With a lot of creativity, some possible options to reduce costs could include:
Note that all these cost reduction options are linked to the information provided by the company. And since the only managerial information we have is the amount spent on these costs and expenses, we are limited to actions related to this!
Now… imagine for a moment if these same costs were broken down by activities, considering their direct and indirect costs. Some of them would undoubtedly include:
Note that some possible actions now include:
Notice that instead of focusing on specific expenses, we are now also managing by activities, understanding how much each one contributes to the company’s results, proposing improvements, and conducting much more efficient management.
Now, imagine the same previous example, but applied to a bank and with an activity breakdown as follows:
After calculating the activities, including the correct assessment of indirect costs, it was discovered that the “Credit Analysis” activity cost $900,000 per year. If the total number of analyzed credits was 3,000, we can understand that the cost of each analysis is $300.
The first question to ask is: what is the value of each credit analysis? This is because the cost of the process is often more expensive than the actual cost of the credit being granted!
next, it is essential to consider ways to reduce these costs. Out of the $300 for each credit analysis, it was discovered that $50 was spent only on employees’ overtime while entering the credit requests into the bank’s old credit system. This specific task of entering requests could be outsourced for $10 per credit. With just this activity, a cost reduction of $120,000 is achieved.
Other options include rethinking the entire process, digitizing the requests, and even benchmarking between units to try to improve. And mind you, we are talking about a single activity. Learn more about how to develop a cost-reduction project.
Imagine this potential now applied to all the activities in your company – the possibilities are infinite!
While arbitrary allocation of indirect costs can be fatal for a company, accurate allocation can lead to significant increases in profitability through cost cuts based on precise data.
Just like the companies in our examples, your organization can also benefit from cautious and safe cost reduction by observing the costs of each activity in great detail to expand profit margins.
Fill out the form below and find out how!
ABC costing analyzes costs related to each activity in product manufacturing or service execution. Resources are allocated based on these activities to different products, services, markets, etc., providing a clear view of the company’s costs. In this way the company gains a more precise understanding of how each activity impacts operating costs, enabling better profitability management.
Studies and documentation indicate that large US industries used some form of ABC costing in the 1950s. However, the methodology only really became known with the dissemination and popularization of the studies of Professors Robert Kaplan and Robin Cooper in the United States in the early 90s.
These two professors identified that, for several reasons that we will present later, the method used to cost the various products and services no longer reflected the reality of what occurred in organizations, causing great distortions and greatly damaging the results of companies.
In their studies, Prof. Kaplan and Cooper identified 3 independent and simultaneous factors that justified the implementation of ABC costing:
Previously, direct labor accounted for around 50% of total product costs, with materials and raw materials at 35%, and overhead at 15%.
Nowadays, overhead can reach up to 60% of product costs, with raw materials at approximately 30%, and direct labor below 10% (in Service and Government organizations, overhead is even higher).
While using direct labor hours for cost allocation might have been acceptable until the mid-20th century, it no longer makes sense in today’s cost structure.
The number and level of competitors have changed significantly over time. Consequently, many organizations have experienced declining margins year after year, making efficient cost control extremely important.
In this context, implementing the ABC costing methodology enhances cost control, leading to increased competitiveness and improved profit projections.
The cost of implementation and measurement has significantly decreased due to the advancement and widespread accessibility of information technology. In the past, implementing an effective ABC costing system was prohibitively expensive and feasible only for companies with access to large applications running exclusively on mainframes and large computers.
As computer technologies advanced, the methodology became accessible to a broad range of organizations. Thus, the main reason why this costing system only became popular at the time of the publications of professors Kaplan and Cooper was the advance of computer resources (hardware and software). These technological advances allowed the system to move from theory to practice, especially in the implementation of cost models in more complex organizations that required greater detail.
The missing trigger for this popularization coincides with the emergence of mini and microcomputers in the late 1980s and the development of graphical software interfaces through the Windows (Microsoft), OS/2 (IBM), and Mac (Apple) operating systems.
In this way, applications that had previously been intended only for use on mainframes and large computers could be implemented in any organization, making them accessible to the various users and departments of a company.
Thus, today, many organizations have successfully used ABC costing in various segments, such as manufacturing, government, services, telecommunications, banking, logistics, etc. Its use, contrary to what many imagine, is not limited to large corporations, but can also be implemented in medium and small companies, whether public or private. Here, we’ll provide you with comprehensive information about this system, its benefits, and the implementation process. Take a look!
Traditional costing systems have emerged mainly to meet tax and inventory valuation requirements. However, these systems have several flaws, especially if used as management tools.
Traditional costing methodologies focus on the company’s various products, apportioning total costs to them based on the assumption that each item/SKU consumes organization resources in proportion to the volume produced.
In this way, the various “volumetric” drivers such as a number of direct labor hours, machine hours, and raw material value are used as cost allocation criteria to settle overhead costs.
However, this approach results in figures that only reflect an average estimate. Despite the complexity of the calculation, it doesn’t precisely align with the specific characteristics and processes of each company.
These volume-based drivers also fail when dealing with diverse product shapes, sizes, and complexities. Additionally, there is no direct relationship between production volume and the efforts or costs consumed by the organization.
As a result, many managers of companies providing diversified products and services, when applying these traditional models, are making extremely wrong decisions regarding prices, product and service mix, and even processes.
Unlike traditional costing systems, activity-based costing centers on the organization’s processes and activities. It also provides special attention to often overlooked aspects in companies, such as the cost of different customers, channels, markets, and regions – essential for making accurate decisions.
In the beginning, costs from each activity are tracked within the company. Then, these costs are allocated and analyzed to determine how each activity impacts the final costs, enabling a precise assignment of expenses.
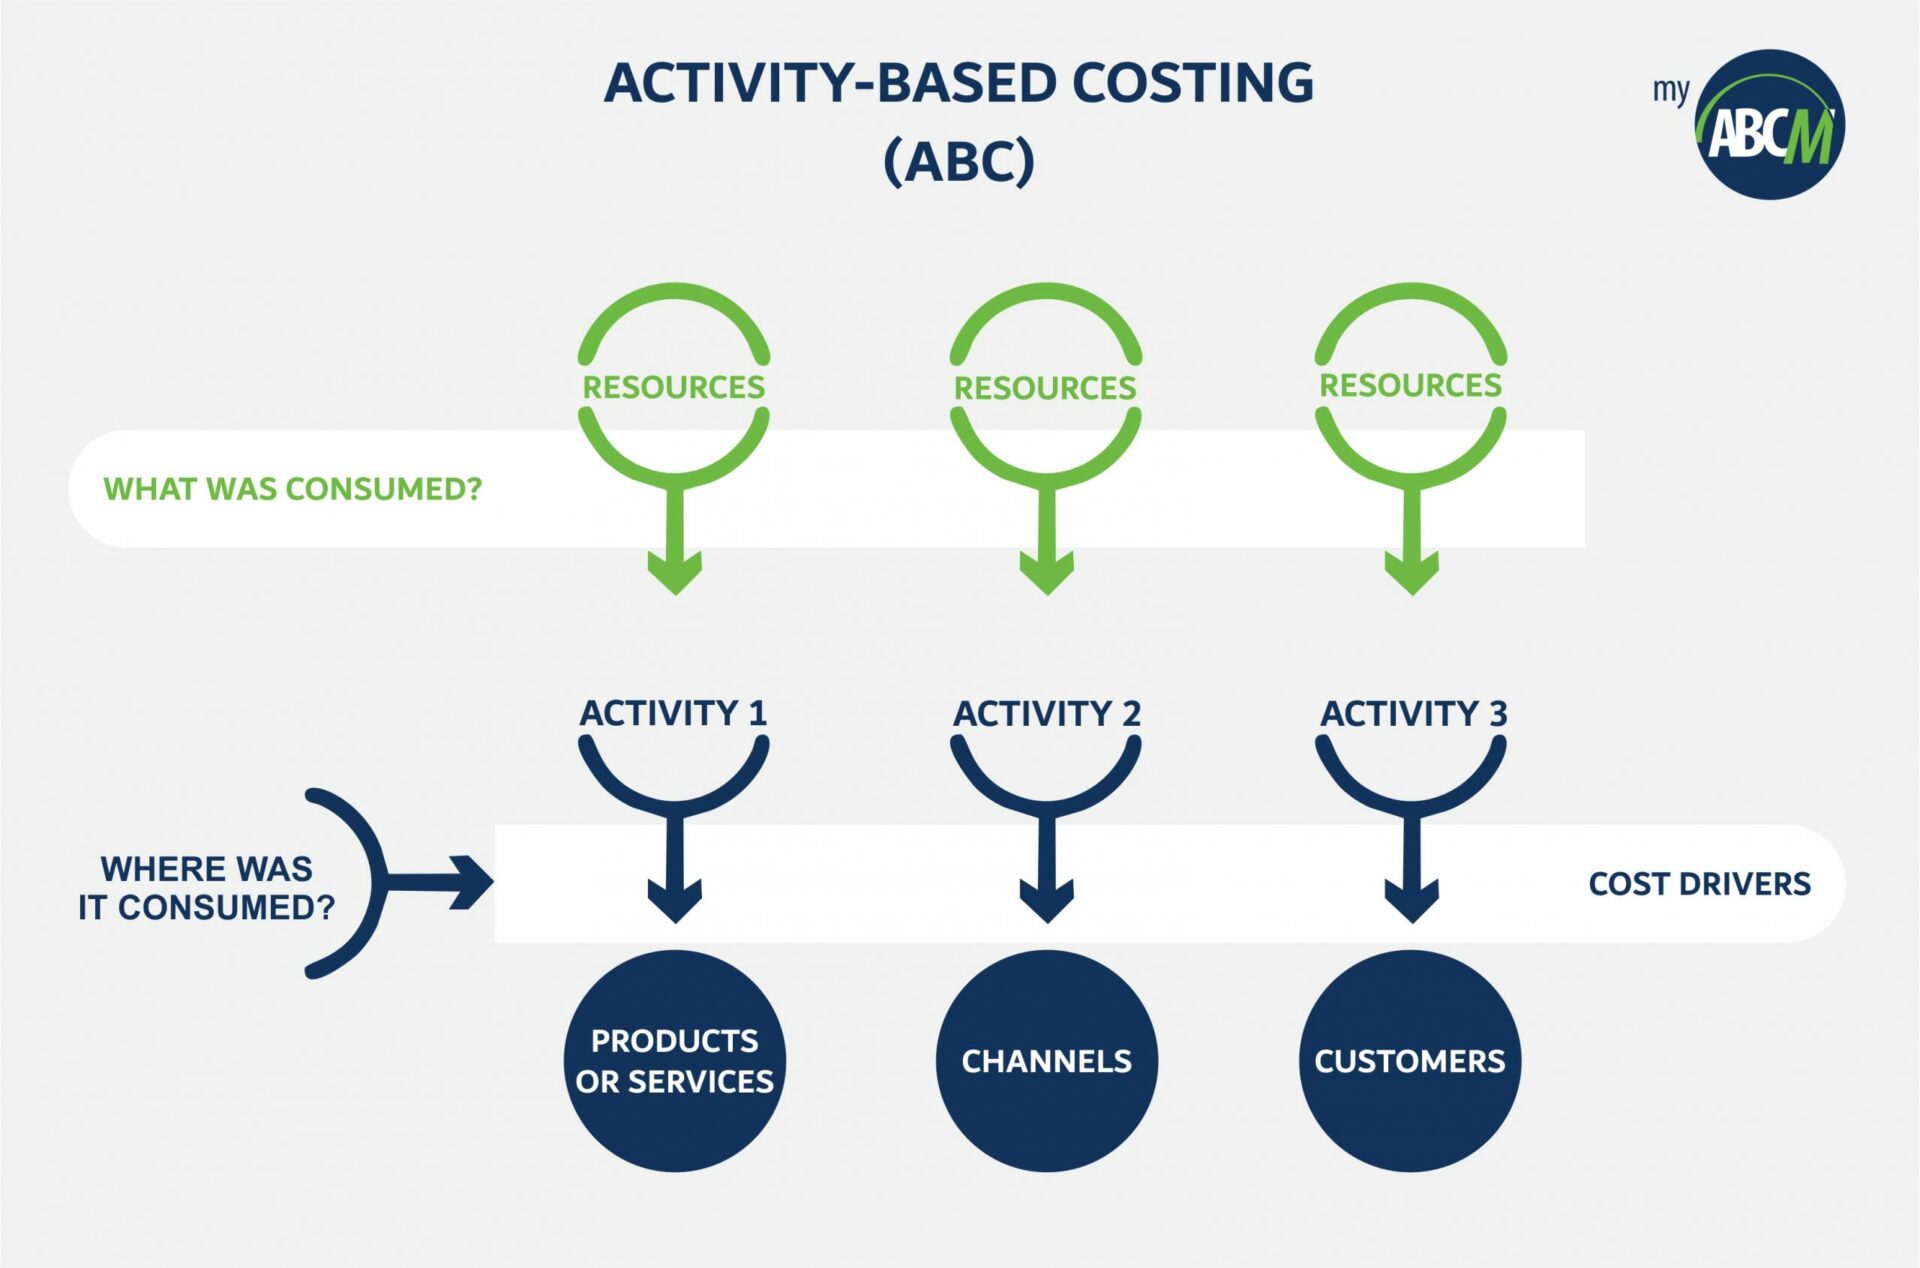
Thus, the various costs are allocated from the various activities to the various Products, Customers, Channels, etc. based on the use of these by each activity of the organization. In this way, overhead is allocated appropriately, always respecting a cause-and-effect relationship and not using “volumes” as the basic apportionment criterion.
Once the activities have been costed, the organization can begin to manage them, frequently questioning why each one is influencing or impacting the costs of the various products, customers, channels, and services in the company. With this system, the costing process becomes more accurate and precise at the same time.
What makes this costing model an extremely efficient methodology is something that starts with the way of thinking about cost. What was treated by other models as an indirect expense linked to a product becomes a direct expense. The focus then becomes the activities performed, not the products that come from them.
The crucial aspect lies in recognizing that each product, service, customer, or channel results from a variety of activities. Treating them individually enhances the description and conversion of their specificities into more accurate values.
The effectiveness of this costing methodology relies on its capacity to establish logical traceability for expenses. As it’s not bound by the temporality of each process, ABC costing can identify and assign each expense to a specific activity.
In this way, even if certain expenses are grouped under the same cost center, they will be organized according to the activity to which each one is linked.
This optimization of cost control delivers multiple benefits to the company across various sectors, as we’ll demonstrate below.
There are several advantages to implementing ABC costing in a company, extending beyond accurate cost definition for products, services, customers, and channels.
Below, we will describe some of the most important ones to highlight how this methodology enhances the company’s profitability and empowers managers in decision-making.
After creating a model with studied cost allocation criteria and defined future implementations, decision-makers gain access to better and more precise information.
This improves the company’s planning and decision-making processes. Managers gain more power in forecasting future profits and expenses and have well-founded arguments for effective decision-making, including product and service pricing, product mix, outsourcing or internalization choices, research and development investments, automation, marketing, campaigns, and more!
In this item, we can mention not only the collection of more transparent data on expenses in each sector but also a review of internal controls and greater visibility of each process.
With comprehensive information about various processes and their impact on Products, Services, Customers, and Channels, the company can make more confident decisions. Managers gain additional tools to manage team expenses and access data for auditing and expense analysis.
With a clear understanding of activity costs, managers can base decisions on business processes and activities. Moreover, by assigning “labels” to mapped activities, they can analyze which ones add value and which ones do not, for instance.
Describing the specificities and costs of each process enables a multidimensional analysis of expenses in each activity, from a global perspective to detailed visualization of each activity’s cost and its impact on profitability. This identification allows adjustments to reduce unnecessary expenses and revise planning to align with actual costs.
Achieving an increasing cost reduction, then, becomes only a matter of time, as each manager will have access to more accurate information to analyze these processes.
Additionally, it’s essential to note that the methodology’s effectiveness in controlling expenses makes it efficient for both small and large companies, regardless of their area of operation.
The implementation of an ABC costing system may seem complicated and will vary slightly depending on the size and complexity of each company’s activities, products, and services.
But to facilitate the process and enable the implementation of the ABC methodology to be carried out effectively, you can use the steps listed below as a reference.
They apply to all sizes of companies and business models, helping to create an activity-based budget and promoting greater control over the organization’s costs and profitability.
Sophisticated cost modeling demands a dedicated system. While some companies use spreadsheets for costing, others attempt ERP customization or believe BI can address management costing challenges.
However, the auditing and consulting company Ernst & Young (EY) does not recommend any of these options. According to EY, “Model development can be performed in Excel, Access, or even in-house development, but this can only be done for very simple models and even these simple models will present severe restrictions when more elaborate analysis is required. Not to mention specific issues of integration with existing systems, traceability, auditing of the model, and the security of the data itself.”
As for ERP implementation, we know how expensive and complicated it is to customize these systems. In addition, they provide a static and plastered view, which does not provide the flexibility required by such an implementation.
As for BI systems, these are platforms for presenting the information that already exists in the organization. But as we know, such cost modeling requires deep transformations from the point of view of allocations, including reciprocities and understanding of costs at multiple levels and dimensions, something not so easily or virtually impossible to implement in a BI.
By addressing these practical implementation issues, the MyABCM product suite stands as the global leader in managerial costing solutions. Offering multidimensional analyses, it empowers organizations to model, analyze, and simulate with great flexibility, security, and, most importantly, full integration with corporate systems.
It is crucial to determine the objectives of an ABC costing project. Does it aim to determine costs for Products only? What about Customers, Channels, Markets, Regions, or Projects? Defining clear project objectives is essential to avoid mid-project changes in assumptions.
Additionally, creating an implementation agenda is crucial, including defining the desired depth of the project, possible criteria, ideals, and implementation milestones.
Efficient implementation requires intelligent activity mapping. In such projects, managers often aim to map hundreds, thousands, and, at times, tens of thousands of activities, sometimes even at the task level.
This is an attitude of great inefficiency, since by mapping many activities, the effort will certainly be too great to result in a small benefit, especially for those activities that are not very relevant. In addition, modeling too much complexity in the first round makes the initial integration of the model with corporate systems a major challenge.
“Best practices involve modeling in stages, increasing complexity as the model evolves while considering the relevance of the mapping. As noted by Cost Management expert Gary Cokins, ‘Organizations must assess their performance in what is crucial and relevant to the business.”
Here it is necessary to define the initial costs, expenses, cost centers, accounting accounts, possible groupings (Cost Pools) to be established, and Revenues that will be the initial Resources to be allocated.
This part of the planning is important so that each Resource is linked to a process and this is identified according to its relationship with the activities linked to a product, service, customer, channel, or project.
After defining Resources and Activities, establish cost drivers and the criteria for their utilization.
In this way, the calculation process will make sense, as there will be a link that represents a cause-and-effect relationship between sources and their destinations.
Once the model is defined, it is time to calculate it, generate simple and complex cubes (which will later support the various analyzes through dynamic tables), and create a system that allows simple and advanced simulations (what-if).
By applying and analyzing reports, it is possible to evolve the system, effectively tracking an increasing number of relevant activities for the company.
Implementing an ABC costing system provides better control over the organization’s costs. The methodology develops precise cost tracking and allocation models, identifying values associated with each process and activity, and their impact on company profitability.
This enables an efficient activity-based management system, facilitating resource reallocation and structured cost reduction, promoting high profitability even in a highly competitive environment.
Moreover, the system empowers confident decision-making, providing secure pricing and comprehensive analysis and control of products, markets, channels, customers, etc.
Thus, its implementation culminates in greater profitability in the medium and long term, thanks to a detailed view of organizational processes and the resulting increase in the company’s competitiveness.
By considering the tips in this article, you can efficiently implement the activity-based costing methodology, leading to continuous growth for your company.
In this context, MyABCM software is specially designed to offer activity-based management, enhancing cost control and business profitability.
Hence, employing a system like MyABCM solution surpasses the activity and cost management capabilities of other software. The systems are tailored to address the specificities of businesses of all sizes, offering resource allocation in multidimensional analyses that cover all relevant company activities, adapting to various complexities, and ensuring the constant evolution of costing models.
Interested in learning more about our solutions and how ABC’s costing methodology can boost your business profitability? Fill out the form below to get in touch with our experts!
Cost reduction in companies is always a goal, but it is becoming an urgent need as organizations’ margins shrink worldwide. Some contributing factors include government pressures, rising taxes, new competitors, increasingly demanding customers, issues now such as ESG (environmental, social, and corporate governance), shortages of skilled labor, and supply chain problems.
Therefore, reducing costs and expenses is the top priority for companies. And when we talk about reducing costs, we immediately think about laying off employees.
Before we start, let’s clearly understand the differences between costs and expenses. Then, we will discuss the reasons why we are looking to make a cost reduction in companies.
Cost is any value applied in producing a product (in the case of manufacturing companies) or in providing services (for service organizations). Some examples of costs are labor, raw materials, inputs, as well as the amount spent on the production of this product or the provision of this service with electricity, maintenance, depreciation of machinery and equipment, cleaning, and conservation materials, among others.
In addition, costs can be classified into:
Expenses include all the amounts spent by the company to keep it running.
Usually, the expense is related to everything spent in the area of sales, finance, administration, human resources, systems, marketing, and the BackOffice in general. Therefore, expenses are a type of expenditure that has no direct connection with the company’s “core” activity, such as producing goods or providing services.
However, even if they do not contribute directly by generating new items to be marketed, expenses play an important role and certainly their use can have an influence on increasing the company’s revenue.
And in turn, expenses can be classified as fixed or variable:
In this context, it is worth noting that expenses are costs and expenses in general. And typically, when someone talks about reducing costs they are talking about “reducing expenses”, but in a “colloquial” way. Thus, it is worth remembering that it is also essential to analyze the possibilities of reducing expenses in the organization.
Want to understand in more depth? Click here and read 5 tips to improve your expense and spending control.
The question above is very simple, right?
But its answer is inversely proportional, proving to be extremely complex.
Reducing costs is one of the greatest allies of profitability. Every company seeks to reduce costs without measuring efforts, but as we mentioned, it is a very complex task. We must be aware that when reducing costs, we must always be cautious not to cause negative impacts and end up in deficit.
To better understand how to adopt a cost reduction strategy without negatively impacting your results, click here and read our full article.
Were companies that attempted cost-cutting satisfied with their initiatives?
Not always: research by the US Conference Board found that of all the companies that have tried to cut costs:
A study by Deloitte showed that 75% of companies that laid off employees to reduce costs had to rehire others for the same positions within one year.
Another survey, this time by McKinsey, showed that only 10% of cost reduction projects were successful three years after implementation.
But why did these reduction initiatives fail? Surely because of the lack of a better understanding of how resources were consumed in organizations. The natural consequence of not measuring properly is the inability to manage well.
To solve this problem, see 8 actions that will reduce your costs and, consequently, increase your profits:
But the main lesson of all is: understand your costs.
Not understanding exactly how much a product, service, customer or channel costs ends up damaging the entire decision chain of companies! Definitions such as what prices and tariffs to practice, which customers to serve, what discounts we can grant and what commissions to pay our salespeople among many others go through a real understanding of costs and the ability to measure them properly!
Did you know, for example, that between 20% and 40% of products and services make a loss? And that 20% of customers are loss-making? See more on the subject in this article dedicated to service costs!
So, it raises the question: what actions will we take immediately after identifying bottlenecks in our organization?
Sergio Marchionne, the former CEO of Fiat/Chrysler, played a significant role in the company’s revival in the 90s. Besides being a great manager, Sergio Marchionne has always had a great sense of humor. After the launch of the Fiat 500e electric car (better known as the “cincoecento electrico”) Sergio went public and asked, “Please don’t buy our cincoecento!”.
A few months earlier the Fiat 500e had been launched with much pomp and circumstance, consuming many millions of Euros with the promise of being the great European competitor of Tesla and with the advantage of being extremely economical. The product launch experienced many delays, and when it was finally ready, only a few units were sold. Studies showed that the loss for each unit sold was 20,000 euros!
Undoubtedly, understanding costs and establishing strategies to control them are significant challenges in company management. And this cannot be overcome if we do not have a clear ability to make the best decisions, with well-defined methods, processes, and appropriate methodologies for the significant challenges that lie ahead.
Do you need help with cost reduction in your company? Fill out the form to talk to our experts!
Cost reduction can be challenging, but it is often an inevitable process given the competitiveness of globalized markets. No matter how good a business or product is, no company is immune to crises or periods when demand is not exactly as expected.
To avoid mistakes in this very sensitive moment in business management, in this article we will look at five fatal mistakes in the process of cost reduction.
If the expenses with personnel are suffocating your finances in a moment of crisis, know that the dismissal of part of the staff can be disastrous for your company. In the short term, this attitude generates the discontent of those who stay on and the distrust that they could be next.
Additionally, expenses with severance pay can worsen your company’s finances, creating cascading problems by decreasing production capacity. If the intention is to get out of the crisis, you will need staff ready to work.
And rehiring after realizing that the dismissal was a mistake can significantly increase your costs. According to data from Gallup Consulting, replacing an employee can cost twice as much as keeping him.
In other words, layoffs are generally not a good way to cut costs, and you must analyze this alternative carefully before choosing it.
As sales decline, the first impulse is to cut back on advertising. Don’t give in to this impulse, because marketing is the main responsible for bringing new customers into a business, and you will need them.
Don’t think like your competitors: advertise not only your main products in the search for new customers, but keep your brand always present in the media, showing that your business was either little affected or not yet affected by the bad winds of the financial crisis.
The quality of the coffee served to employees and customers, the quality of the napkins, the plastic cups, and even the toilet paper is probably something that can be reviewed. However, it is not advisable to waste management’s precious time on expenses of minor importance and materiality for the business.
Besides generating great dissatisfaction from employees and customers, this attitude will not bring significant savings, spending management time that could be applied in other more important points.
Cost reduction can be achieved by saving money by not spending at one point, but also by reviewing processes throughout the company. If this has been an old plan, it is time to review all operational spheres.
Call managers and supervisors to discuss what can be reviewed or restructured. Everything can be reviewed from production processes, administrative processes, and even customer service, bringing more quality and less financial expenses to the company. In this scope, it is very important to pay attention to the indirect costs generated by each activity, because these often go unnoticed and can bring valuable opportunities for cost reduction.
If the idea is to try to maintain sales levels and get your brand seen more by your current customers and potential customers, quality has to be maintained. Sometimes small cost reductions will lead to very large decreases in the quality of the final product or service.
Therefore, analyze deeply your production expenses and the possibility of reducing them, because if there is one thing that cannot be changed when the demand for a market decreases, it is the quality of the product or service that you offer.
Cost reduction without Mystery
Cost reduction must be constantly analyzed by managers, and in periods of crisis the need for it becomes more latent. However, it is necessary to evaluate the feasibility and impacts of cost review actions, because they can bring more harm than financial breath to your organization.
Check out 8 tips to reduce costs efficiently!
To ensure that cutting business costs brings positive results, it is essential to have a good understanding of the sources of costs and how they relate to the organization’s activities and revenues. This can be a challenging analysis, so MyABCM is specifically designed to help organizations visualize and control their costs efficiently.
Learn how it can help you! Fill out the form below:
Financial decision making is especially challenging in a business. In this context, FP&A is a valuable tool to optimize the use of resources and thus guide investments, increase profitability, and bring better results to the organization.
In practice, FP&A comprises a group of four main activities whose function is to assess and maintain the financial health of a company:
These activities collectively offer a comprehensive view of the financial situation, enabling the identification of trends and opportunities through the monitoring of the business’s financial performance.
Although the two concepts are related, they are differentiated in that they play distinct roles in a company. While financial management encompasses corporate finance activities more broadly, FP&A falls within the scope of financial management and is dedicated to strategic planning, analysis, and informed decision making.
While financial management encompasses accounting, cost control, cash flow, investments, and risk management, with a strong emphasis on documentation and operations, FP&A brings a strategic dimension to financial management. It focuses on analyzing the organization’s financial data to enable informed decision making and establish realistic, measurable goals.
In essence, while financial management aims to optimize day-to-day operations, FP&A leverages financial information to steer the company, mitigate risks, and optimize outcomes in the medium and long term.
To implement FP&A effectively, it is crucial to have accurate and reliable data sources. The financial management team should utilize data collection and consolidation tools, while also ensuring the availability of relevant accounting information for the various FP&A processes.
Some of the most relevant documents and information to support FP&A include:
It is important to highlight the existence of another strategic model called xtended Planning and Analysis (xP&A), which enriches the financial analyses performed in FP&A by incorporating additional dimensions.
It employs the best FP&A capabilities, such as forecasting, ongoing planning, and performance monitoring, and combines them with other metrics and information that are not typical of financial statements, generating a more comprehensive view. Data used includes employee turnover, customer acquisition cost, customer experience, etc.
Applying FP&A can be an important competitive differentiator. By providing detailed financial analysis, FP&A brings valuable insights that help identify savings opportunities, optimize resource allocation, and make financial decisions based on historical and predictive data, with controlled risks.
Investing in sustainability is a strategic imperative for every company. First and foremost, it is crucial for preserving life as we know it. But it is also a matter of market positioning. Taking actions to reduce the environmental impact caused by your activities positions your organization favorably in the market and often facilitates access to government subsidies and support” for a more direct and concise statement.
If your company doesn’t already have a project focused on environmental preservation, now is the perfect time to start. And it may be simpler than it sounds. Understanding your business’s carbon footprint is the initial step to determine where to begin implementing efficient and impactful actions for the benefit of all.
A carbon footprint is a measure of the atmospheric emissions of greenhouse gases (GHGs) that contribute to climate change, impacting ecosystems worldwide. It can be calculated at various levels, ranging from an individual’s footprint to that of organizations and entire countries.
The carbon footprint includes gases such as carbon dioxide (CO2), methane (CH4), nitrous oxide (N2O), chlorofluorocarbons (CFCs), ozone (O3), and even water vapor. These gases are emitted as by-products of various activities, ranging from transportation to the production process and the disposal of materials.
In this context, certain market segments, such as energy, industry, and transportation, are recognized for generating larger carbon footprints. For example, in countries like the European Union, the USA, and China, the majority of emissions stem from energy and heat production, whereas in Brazil, they predominantly result from agricultural activities.
There are many online calculators available to help your organization calculate its carbon footprint. For instance, the 2030 calculator, aligned with the UN’s Agenda 2030, was developed specifically to assist companies in determining their carbon footprint. It is the result of a partnership between the United Nations Framework Convention on Climate Change and a Swedish FinTech company.
More comprehensive than other calculators found online, it requires specific information that varies based on your company’s business segment (education, industry, consulting, etc.). For industrial sectors, the required data includes:
This calculator is a valuable tool for your company to visualize the environmental impact of its operations and develop actions to mitigate it. However, it is essential to note that for a more sophisticated and comprehensive analysis of your organization’s carbon footprint, it is necessary to have precise and more comprehensive data about your business activities and utilize additional tools for processing.
Are you aware that you can utilize MyABCM to calculate your carbon footprint? This software offers flexibility and can integrate with an organization’s various systems. It can be configured to employ CO2-eq (carbon dioxide equivalent) as the unit of measurement, enabling precise and automated tracking of the carbon footprint.
From this information, it is possible to develop methods not only to reduce emissions but also to safely enter the carbon credit market and put in place compensatory actions to help minimize the organization’s carbon footprint.
The carbon footprint is a vital metric for companies to comprehend the environmental impact of their activities and implement sustainable measures. This in-depth analysis enables the exploration of opportunities in the carbon credit market and the pursuit of compensatory actions, ensuring operations with reduced environmental impact and a favorable market position, with enhanced prospects for government support and the establishment of a significant competitive advantage.
BPCE is one of the largest banking groups in Europe. For this reason, it requires cutting-edge technological support, which is provided by Informatique Banque Populaire (IBP), one of the group’s affiliated entities. IBP’s role is to create innovative technology solutions that simplify banking processes.
In addition to developing information systems for the group’s member institutions, IBP’s experts are responsible for designing, testing, and launching IT applications across various business sectors, including consumer finance, trade promotion, leasing, and other related services.
Managing the development of solutions in the banking industry, with its stringent requirements for security and usability, presents several challenges. In this context, IBP suffered from some difficulties associated with its billing model and a heavy reliance on Excel in its internal management activities.
Therefore, the institution sought a system that could meet these demands, optimize workflow, and fully automate the billing process.
Among the various options available, IBP selected MyABCM, based on its cost-effectiveness and the positive experience of BPCE in implementing the software.
Choosing MyABCM provided IBP with scalability beyond what Excel allowed. Additionally, it benefits from an optimized workflow on the platform that promotes user collaboration. Other significant benefits positively impacting the organization’s routine include scenario simulation, previously impossible with simple spreadsheets, and the ability of each operational department to analyze results confidently and reliably. Implementing MyABCM also enhanced data management security, reduced the risk of errors occurring, and increased team productivity.
Using specialized software for cost and profitability management, IBP now has a clear understanding of its costs and the impact of its business activities, linking cost sources to corresponding activities. The management team also values the increased control over refund and traceability resources, which are now acknowledged as valuable business assets, and experiences increased production capacity within the team.