


Cost allocation is a highly important topic for any company seeking to understand its true profitability. However, it’s common to see businesses relying on generalist ERP systems or solutions focused on tax and accounting management to monitor their costs.
This is a critical mistake. While these systems are excellent for managing tax obligations or providing an overview of financial performance, they are not designed to track and allocate costs with the level of detail necessary for efficient management. As a result, strategic areas such as FP&A (Financial Planning & Analysis) are limited in their ability to deliver accurate insights for financial planning and decision-making. Additionally, products and services that appear to be profitable may end up generating losses, while others considered unprofitable might actually be sustaining important margins for the company.
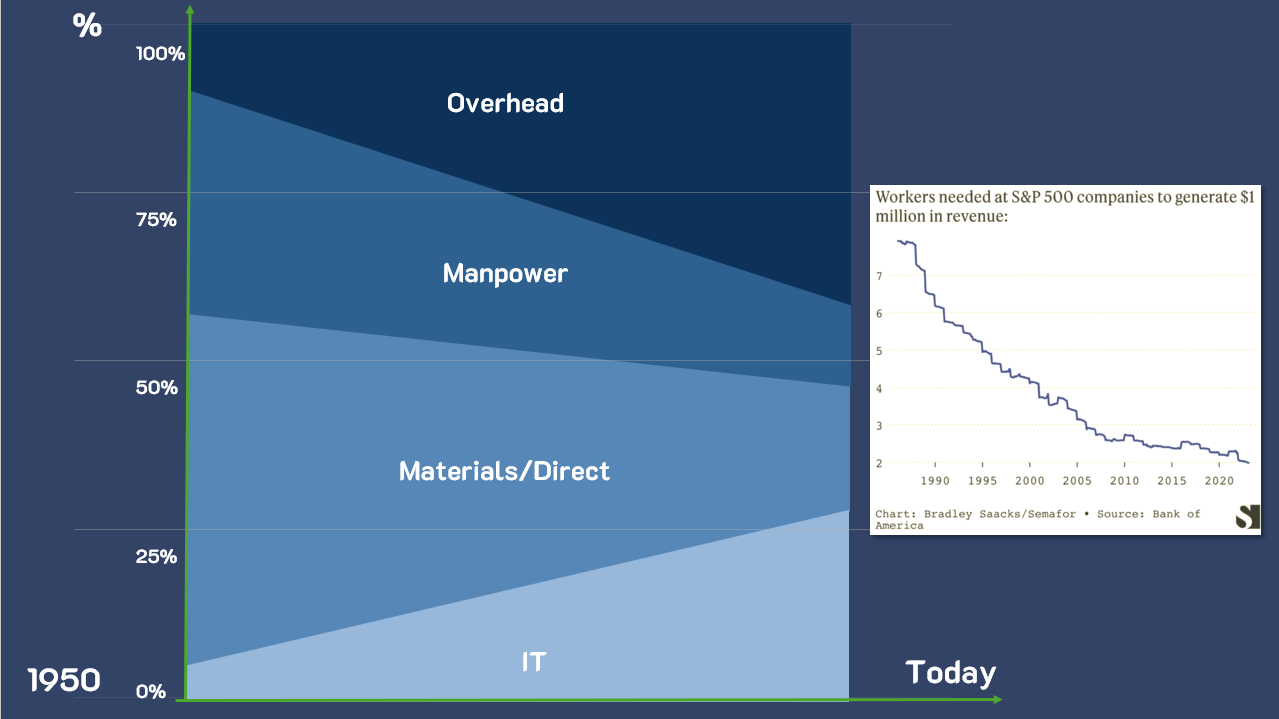
The composition of costs has changed dramatically over the past few decades. In the 1920s, every dollar spent on administrative areas corresponded to an investment five to ten times higher in operations. Today, the situation has reversed: administrative costs can be double or even triple the amount spent directly on operations.
Moreover, technological advances have transformed the costs of materials and direct labor. With automation and the introduction of artificial intelligence systems, technology expenses have skyrocketed, while direct labor costs have proportionally decreased. This has further increased the complexity and impact of indirect costs on the overall cost structure.
Many companies still rely solely on generalist management systems, which centralize business administration but cannot handle the complexity of cost allocation. Furthermore, according to a PwC study, 31% of companies do not allocate costs at all, while 69% do allocate costs but based on simplified criteria such as sales volume or revenue, often leading to inconsistencies.
Without a specialized tool, it is impossible to identify the true costs of departments like IT, HR, legal, and logistics, which support operations but are not directly tied to them. Additionally, the diversity of products, services, channels, and processes only increases the need for a system capable of detailing these costs and providing reliable analyses for strategic decisions.
In this context, ABC costing stands out as an effective solution for managing the complexity of different cost sources, enabling more accurate allocation based on appropriate drivers. A practical example of this is the story of one of our clients who, before implementing MyABCM, used imprecise methods to allocate about 35% of their costs. This caused serious inconsistencies in their management. After adopting a more precise approach, the company was able to redefine its strategies and optimize its net margin, even while operating with tight numbers.
A specialized approach to tracking and allocating costs allows you to turn assumptions into concrete data, creating a clearer scenario for decision-making. This not only increases operational efficiency but also helps identify improvement opportunities that might go unnoticed in generalist systems.
It’s time to reevaluate how your company views costs. Fill out the form below and discover how our software can transform your management and maximize your profitability.
When it comes to cost-cutting, laying off employees might seem like a simple and immediate solution. After all, personnel expenses often represent one of the largest costs within organizations.
However, over the years, studies have shown that this practice can cause more harm than benefit in the medium to long term. Layoffs do not solve structural issues and, in many cases, may even increase a company’s costs.
According to The US Conference Board, 30% of companies that resorted to layoffs expecting cost savings saw an increase in expenses. Additionally, 22% of them ended up laying off the wrong employees, leading to the loss of valuable talent and the need to hire again.
Beyond the immediate impact, laying off and rehiring creates an expensive cycle. Deloitte indicates that 75% of companies that laid off employees to cut costs eventually had to rehire for the same positions within a year.
It’s worth noting that these costs include not only the selection and hiring processes but also the training and adaptation time for the new hire, who typically has lower productivity initially. In other words, the initial cost of a layoff (which is already not low) ends up being added to long-term investments to replace an employee who shouldn’t have left.
These figures reflect a concerning reality: layoffs may seem like a quick fix but fail to address deeper operational issues with more significant impacts on business costs, such as inefficient processes and hidden waste. In the end, they may actually generate more unnecessary costs.
McKinsey & Company points out that only 10% of attempts to cut costs through layoffs prove effective after three years. This is due to the fact that, without revising internal processes, companies end up redistributing unproductive tasks to a smaller team, potentially compromising the quality and efficiency of work.
For this reason, companies must focus on identifying which processes add value and which can be optimized or eliminated. Without this review, layoffs only exacerbate problems, placing an even greater burden on remaining employees.
A study by The Economist highlighted that companies surviving crises are those that know where not to cut costs. They prioritize strategic areas that ensure customer satisfaction and maintain processes that generate value. In other words, the secret isn’t in layoffs but in improving efficiency and ensuring that resources are being used wisely.
Instead of turning to layoffs as a cost-cutting solution, companies should focus on efficient cost management by analyzing processes, eliminating redundant activities, and keeping customer satisfaction a priority. The key to success isn’t cutting staff, but optimizing operations and allocating resources (including human resources) more strategically.
Want to find out where to cut costs without laying off employees? MyABCM can help. Fill out the form below to learn more!
In the dynamic world of cost and profitability management, selecting the right tool can be critical to business success. In this context, with a variety of systems available in the market, organizations often find it challenging to choose the appropriate tools to support the process of monitoring costs and corporate financial performance. In this article, you will discover why MyABCM stands out as a better alternative to one of these tools: SAS ABM, with advantages ranging from support to operational capacity and flexibility.
Many companies that used SAS would turn to SAS ABM to manage their costs but soon encountered its limitations, given that the solution’s focus is statistical, concentrating on identifying patterns in the analyzed data. In other words, the tool collects information and delivers results such as statistics and analyses, assuming a role very similar to that of a BI.
MyABCM, on the other hand, used in over 50 countries, was specifically developed for the calculation of business costs and profitability, with differentiated support, ensuring that users have assistance when needed. This feature is crucial to avoid difficulties in obtaining help, providing peace of mind to users.
MyABCM was designed to operate in conjunction with other software used by organizations, enhancing the use of the company’s data. Thus, it integrates fully with all BIs and ERPs on the market, including SAS, ensuring greater efficiency in organizational routines.
The speed of implementation is an essential factor in choosing a cost management solution. While SAS ABM has a longer, outsourced implementation, MyABCM is deployed by specialists from the internal team and stands out for its quick setup.
This agility allows companies to quickly start their cost management projects, optimizing transition time and minimizing potential impacts on daily operations.
Data processing capacity is another area where MyABCM excels compared to SAS ABM. MyABCM has a powerful calculation engine with optimized processing capacity and speed. Its specialized distribution mechanism, including reciprocal allocations with in-memory calculation, ensures reduced calculation times. This not only saves the organization’s resources but also speeds up the construction of OLAP cubes and modeling analyses, providing more efficient cost management.
Usability is a fundamental aspect in choosing a cost management tool. While SAS ABM features a less intuitive layout and visualizations, resulting in greater dependency on support and less efficiency in using the solution, MyABCM stands out for its ease of use and intuitive interface.
Moreover, MyABCM ensures greater flexibility, allowing quick and simple revisions and adjustments in cost modeling. The system also accommodates organizational changes without the need to alter the model, preventing the loss of historical information. This autonomy and ease of adjustment make MyABCM a strategic choice for organizations seeking a flexible and adaptable solution, with low dependency on support.
In summary, MyABCM emerges as the best alternative to SAS ABM, offering not only reliable support but also rapid implementation, efficient processing capacity, and superior usability. By choosing MyABCM, companies ensure not only a cost and profitability management that meets their needs, with comprehensive and versatile features but also secure a solid foundation for growth.
Fill out the form below and talk to our experts to see MyABCM in action!
Cost analysis in TOTVS is possible with the Protheus system, but it can still be challenging for companies using it in their management processes. There’s no doubt about the quality of the solution for operational routines, as the ERP performs various managerial functions with expertise. However, when it comes to strategic cost management, some limitations may become apparent as the difficulty in understanding the origin and impacts of costs has repercussions on organizational performance.
In this scenario, MyABCM is introduced as a solution specifically developed to optimize costing and enhance business profitability.
It is no coincidence that TOTVS is a market leader in ERPs with solutions like Protheus. However, despite the system’s quality, it is essential to understand that its cost management tools have a more accounting, statutory, and fiscal bias than a managerial one. While ERPs encompass resources such as technical data sheets, chart of accounts, inventory positions, sales volume, and production, the allocation of indirect costs (vital for the financial health of any organization) is overlooked.
Additionally, there are other blind spots when it comes to cost management in an ERP. What if we need to understand who are the best and worst customers from a profitability perspective and not just from revenue? What if we need to reduce the number of allocations to improve cost accuracy?
In these cases, companies have two options:
This is where we come in, to make the day-to-day life of FP&A, Cost, Controllership, and the financial area in general easier, with a powerful and efficient solution.
Companies that already use TOTVS do not need to abandon it to improve cost management, nor resort to spreadsheets that become confusing and difficult to update. MyABCM is a powerful ally, capable of integrating with TOTVS and other systems used in the organization, creating a data ecosystem in which each software contributes its best features to optimize the company’s management.
In other words, MyABCM enhances cost management in TOTVS, offering a robust calculation engine, notable for being the only one on the market to manage cascade costs and reciprocal costs in all modules.
MyABCM features a ready-to-use calculation engine that only needs to be configured for the company. This simplifies the implementation process and allows for quick adaptation to the specific needs of the business.
Offering unmatched flexibility, MyABCM allows for the construction of a model with an unlimited number of modules and dimensions, easily adapting to the complexity and diversity of businesses.
MyABCM ensures traceability between all axes and allocations natively, eliminating the need for additional developments. This provides a clear and reliable view of the company’s financial health.
By enabling reciprocal allocations between interdependent sectors, MyABCM offers an accurate view that is not possible when trying to analyze costs directly in TOTVS.
With its advanced push and pull simulation capabilities, MyABCM enables the creation and exploration of various financial scenarios. This advanced feature surpasses the capabilities of Protheus, providing an understanding of the financial implications of different situations that the company may face.
MyABCM allows for meticulous tracking of costs in different contexts. With it, the company can analyze and compare actual, budgeted, standard, and cost targets, to get a snapshot of the organization’s financial performance.
Cost management in TOTVS through the Protheus solution can reach new heights of efficiency and strategy when integrated with MyABCM. With unique functionalities specialized in cost and profitability management, MyABCM elevates financial management, providing better results for companies seeking a more advanced approach to cost management. Want to learn more about cost management in MyABCM and how to integrate it into your ERP?
Fill out the form below and speak with one of our experts!
Oracle EPM is a popular system for financial consolidation and closing activities. However, its capabilities for calculating an organization’s costs and profitability are not as powerful, creating challenges for users who try to use it for this purpose.
In this article, we will explore why MyABCM is the more advantageous alternative for calculating business costs and how it can be used in conjunction with Oracle. Currently, about 40% of our clients use Oracle seamlessly integrated with MyABCM and enjoy all the benefits of having a quick, reliable, and easy-to-implement cost management solution.
Oracle EPM is a suite of enterprise performance management applications that offers various functionalities, including planning, consolidation, and financial closing. While it is a robust solution, there are some limitations to consider regarding strategic cost and profitability management.
While Oracle EPM is a comprehensive solution, MyABCM stands out for its specialization in cost management. Designed to effectively manage overhead, MyABCM minimizes allocations and uses more sophisticated allocation rules that make more sense for organizations, allowing for the correct identification of different costs. In this scope, it enables managerial costing of dimensions beyond just Products or Services, including Channels, Customers, Segments, and Businesses.
For these reasons, many organizations that have the Oracle ERP eventually migrate to MyABCM, which addresses these issues more efficiently, more agilely, and with a much faster implementation.
One of the main advantages of MyABCM is its speed of implementation. While Oracle EPM may require an extended implementation and customization period, MyABCM is known for its agility, with implementations that can be completed in just a few weeks, depending on the organization’s needs. This means your company can start reaping the benefits sooner.
Cost is an important consideration for many companies. And for most cases, MyABCM is a more viable alternative compared to Oracle EPM. With tailored solutions for businesses and projects of different sizes, the system offers greater economy and a high cost-benefit ratio, enabling cost calculation without burdening the organization.
MyABCM is praised for its efficiency and flexibility. It is designed to meet the needs of cost management and offers a wide range of features that can be customized to meet your company’s specific demands, and it is more user-friendly, reducing the reliance on support for modeling and report generation.
A concern when implementing a solution is integration with other existing systems. MyABCM integrates seamlessly with Oracle solutions, making migration and coexistence between the two systems smoother. Moreover, it is designed to integrate with BI tools and various software used in the organization, such as SAP and TOTVS, among others.
MyABCM can quickly provide information after accounting closure and facilitates easy cost management. This allows financial and management teams to access critical data in a timely manner and make decisions much faster.
MyABCM offers a Multidimensional Profit and Loss Statement (P&L) with complete traceability, enabling detailed analyses at the product, customer, and channel levels. This enhanced functionality is vital for making strategic decisions based on accurate information.
As businesses grow, so does the volume of data. MyABCM is capable of handling large volumes of data, ensuring that your organization’s expansion is not limited by the capacity of your financial consolidation solution.
Although Oracle EPM is a solid option for financial consolidation and closing, MyABCM excels in several critical areas, including faster implementation, potentially lower cost, specialization in cost management, seamless integration with other solutions, and quick availability of information.
In 2024, we complete 30 years dedicated exclusively to cost and profitability management, offering a system designed to deepen the understanding of costs in your organization, with detailed data for informed decision-making. If your company values a more agile, economical, and specialized alternative, MyABCM is the solution you are looking for. Fill out the form below and request a demonstration!
Choosing the right software for management plays a strategic role in businesses. While many organizations believe that a single ERP system is sufficient to support their operations, there are systems with different focuses that can make a significant difference in outcomes, such as MyABCM.
Although both are related to the management and control of information, it is important to understand that ERPs and MyABCM serve complementary functions. Keep reading to learn the differences between them.
ERP is a system that encompasses the operational management of various business areas, such as finance, accounting, human resources, inventory, procurement, sales, and production. Its main function is to centralize information and processes, facilitating the integration of activities across departments, as well as recording daily routines and transactions.
MyABCM has a specific purpose, focusing on cost management and profitability. It stands out for its detailed analysis of costs associated with different areas, products, customers, or processes within an organization.
Thus, it goes beyond daily administration, offering a specialized approach to issues such as profitability reports, process and activity analysis, performance indicators, benchmarks, managerial simulations, and much more.
One of the main differences between these systems lies in the purpose for which each was designed. They play different roles in the organization, so that one does not replace the other. ERP offers broad functionalities for business management, covering the departments it encompasses. Its scope can include inventory control, order processing, payroll, accounting to CRM (Customer Relationship Management), among others.
On the other hand, MyABCM focuses on specialized functionalities for cost analysis, profitability calculation, product and service pricing, strategic decision-making, and financial simulations.
Its detailed approach allows companies to deeply understand their costs and profitability, how they relate to each product, service, customer, or sales channel, providing insights to enhance resource usage and business performance.
Cost and profitability management in ERP is quite limited. This is because such systems cover costs primarily from fiscal, tax, statutory, and accounting perspectives, rather than focusing on managerial decision-making regarding costs and profitability. Thus, in ERP, the analysis of costs is more geared towards meeting fiscal requirements than optimizing the organization’s profitability.
In this context, one of the major bottlenecks in cost management in ERP is the imprecise allocation of indirect costs. This type of system employs basically volumetric allocations instead of allocations with criteria that make sense and truly identify how resources are consumed.
Another important limitation is that in an ERP, the focus of costs is only on Product (in the case of manufacturing companies) or Service (in the case of service organizations). However, for efficient cost management, there is often a need to cost other analysis dimensions such as Channels, Segments, Customers, Regions, Businesses, etc.
In a scenario where margins have historically been tightening for organizations across all segments, driving a growing need to ascertain costs for decision-making, companies have two options: try to customize or adapt the ERP (an expensive, complex, and time-consuming solution that requires the support of consultants, integrators, and various experts) or resort to Excel spreadsheets to support these managerial needs.
In contrast, MyABCM was specifically developed to fill these gaps, with features that allow for the calculations and managerial appraisals, eliminating the need for spreadsheets, while integrating with any ERP on the market.
ERPs have a longer implementation period, which can extend for months and require several adjustments to meet the specific routine of each company. This varies according to the complexity of the system and its implementation model.
In contrast, MyABCM has a much quicker implementation, which can take from a few days to a few weeks, depending on the needs of each organization. The implementation team has blueprints and accelerators that speed up the process, making the system available more quickly.
Both systems are capable of generating reports, but the nature and depth of these reports differ significantly. While the reports from an ERP are comprehensive, offering an overview of the company’s operations, in MyABCM, the reports are more specific, providing deep insights into the costs associated with certain areas. This allows for more precise decision-making in terms of financial management of the company.
The system performs a detailed tracking of all costs involved in the activities of the organization. This includes direct and indirect costs, fixed and variable, enabling:
In summary, while ERPs play an important role in the daily management of companies, MyABCM stands out by offering more advanced functionalities for meticulous analysis of costs and profitability, allowing greater financial control and enabling safe decision-making supported by data. Thus, even if a company already has an ERP, investing in MyABCM is a step further to enhance understanding of costs and optimize financial strategies, providing a competitive edge.
Want to see all this in practice? Fill out the form below and request a demonstration!
Organizational management is a vast and complex field, and the diversity of software available to support operations is remarkable. Each type of software plays a unique role, serving specific needs. Therefore, MyABCM stands out as a specialized solution that excels in addressing specific challenges of cost and profitability management in companies, not as a substitute for BI tools, despite having embedded BI to benefit companies without a BI solution.
While BI generates dashboards that merely compile and display information obtained from other software and data sources, MyABCM processes and transforms information cubes, cross-referencing and calculating from various sources to then generate new data that can serve as a basis for cost and profitability management, providing vital reports for decision-making. Thus, it plays a more strategic role, offering features that enable understanding the actual costs of the business across different dimensions, such as channels, customers, activities, and specific products, etc.
In other words, the goal here is to minimize the use of cost allocations throughout the organization and, consequently, eliminate the terrible distortions linked to these allocations that can be very dangerous for companies, impacting various managerial decisions on pricing, sales commissions, discounts, etc.
A BI, on the other hand, seeks existing data in the organization such as Accounting Accounts, Production and Billing Volumes, periods, and others, and presents this information in an organized and didactic way. However, note that here there is no transformation of information, and therefore, the allocations continue to occur. For this reason, Prof. Bala Balachandran from Kellogg University in the United States often comments that “these increasingly sophisticated BI systems allow extremely misguided decisions to be made very simply and quickly!” which is a danger!
Let’s see an example:
Imagine a factory that produces various products from the same raw material: plastic. The ERP records data such as the value of input purchases, payroll, accounting entries, production and billing volumes by product and customer. Potentially, we have here a flawed cost model, since allocations were used for the costs of support areas and, although we know precisely the billing customer by customer, this information is of little use when we want to understand the result customer by customer, after all, we do not have information on the “costs of serving”, we did not allocate marketing and sales expenses for these customers and channels and we do not even know to which areas the IT expenses are being allocated in the organization.
MyABCM, in turn, allows for a sophisticated modeling of costs and profitability, which essentially consists of designing a structure where the various accounting accounts of the company are allocated using allocation criteria that make sense and respect a cause-and-effect relationship through multiple levels until reaching the dimensions necessary for the client to manage their company. These dimensions may include Products, Customers, Channels, Markets, Projects, Businesses, Segments, etc., and also include the costs of support areas. In this way, we have a complete snapshot of costs with full traceability that allows managers to make the best business decisions based on facts.
And if you already have or intend to use a BI, do not worry. MyABCM integrates with all of them.
MyABCM stands out for its ease in the process of construction and data loading in the cost modeling structure. While BI software generally requires complex and extensive configurations, MyABCM is a ready-made calculation engine that requires only parameterization, without the need for development, simplifying implementation.
MyABCM has a robust calculation engine, optimized specifically for the requirements of cost and profitability management. Designed with a specialized distribution mechanism, it is capable of in-memory calculations, optimizing appraisal time.
The scenario-building function allows users to create and explore various hypotheses, providing a broader view of the financial implications of different situations.
Within the scope of scenario simulations, we have another important differentiator of MyABCM: push and pull simulations. The push simulation involves the sequential propagation of changes in variables throughout the model, to understand what the final result would be if some variables were changed. The pull simulation, on the other hand, goes back to identify the initial conditions necessary to achieve specific results, identifying bottlenecks and capacity constraints, and acting as a true sophisticated planning component in organizations.
This approach provides a deeper insight into the financial implications of different scenarios, allowing not only to anticipate changes but also to retroactively understand the factors that led to certain outcomes. This capability goes beyond the possibilities of BI’s, which do not perform such detailed and sophisticated analyses.
MyABCM offers detailed cost monitoring in different contexts, including Actual, Budgeted, Standard, and Goal, providing a holistic view of financial performance.
MyABCM is the only solution on the market that manages reciprocal costs in all modules and with optimized performance at the computer processor instruction level, an essential resource in interdependent organizational environments. By allowing allocations between sectors that share services and resources, MyABCM offers a more accurate and realistic view of costs.
As an example, imagine here that the IT area works for HR and also for Production; already the HR area also works for IT and for Production; note that between HR and IT we have a simultaneous cost allocation that must be calculated in order to avoid distortions in costs – MyABCM deals with this transparently and with extreme agility.
This process goes beyond the cost calculation tools offered by BI’s. The ability to handle interdependencies between sectors, essential for the financial health of the business, is not contemplated in BI’s, precisely because it does not align with their objectives.
BI software is powerful in generating reports. However, they depend on other tools to generate advanced calculations for cost management. MyABCM, on the other hand, offers the ability to create specific reports, tailored to the needs of cost and profitability management of the organization. This allows for a more in-depth and targeted analysis, optimizing the decision-making process.
Moreover, MyABCM offers integrations with other systems, such as ERPs and BI’s themselves, facilitating use in conjunction with various tools employed in the organization.
Ultimately, when choosing between BI software and a specialized solution like MyABCM, organizations should consider their specific needs for cost and profitability management. With its focused approach, advanced functionalities, and ability to provide precise insights, MyABCM stands out as a strategic choice for companies seeking more accurate and efficient financial management.
Learn more about how MyABCM can help your organization. Fill out the form below and talk to our experts!
There are various system options for cost calculation in SAP, varying in value and features.
In this article, we will introduce a Brazilian alternative that not only integrates seamlessly with SAP but also specializes in cost and profitability calculation, offering numerous advantages for your organization.
For companies looking to optimize cost calculation in SAP, MyABCM stands out as a specialized option with many attractive features. Available on the SAP Store, the system integrates smoothly with SAP and offers a series of functionalities that allow companies to get a snapshot of their cost structures, simulate scenarios, and make more confident decisions.
MyABCM offers a series of advantages for companies wanting to efficiently calculate costs and profitability:
While many available solutions may represent a significant cost, MyABCM is more affordable, delivering valuable and efficient features. This makes it an attractive option for companies of various sizes, enhancing the return on investment.
MyABCM is notable for its ability to provide a high degree of cost traceability. This is essential for companies that want to understand the origin of their expenses, optimize pricing, comprehend the role of each product, service, and customer to the organization, and make informed decisions based on accurate data.
The ability to gain insights in less time is invaluable for companies that need to make agile decisions in a dynamic business environment. One of the major benefits of MyABCM is the speed of implementation, calculations, and information availability, combined with smooth data integration between SAP and its system.
MyABCM is used by large companies in more than 50 countries to calculate costs in SAP, covering a wide variety of sectors, including banking, industrial, governmental, healthcare, and many more. This global adoption is a confirmation of its effectiveness in meeting the needs of organizations of all sizes and in different segments, with flexible tools that adapt to the specifics of each business.
For companies looking for specialized solutions to enable integrated cost management within the SAP ecosystem, MyABCM stands out for being accessible and offering functionalities specifically developed to optimize the identification and calculation of costs, with excellent cost-effectiveness. Make this strategic decision: fill out the form below and speak with our experts.
Cost management is an essential but often complex discipline that challenges both students and business administration professors. Going beyond theory and showing how the process is done in the reality of an organization may not be an easy task, but it adds value to teaching and helps prepare students for the realities of the job market.
Therefore, we have developed our academic program with the aim of promoting good practices in cost management and helping educational institutions prepare their students for professional life. See what Professor Alex, who uses MyABCM at Universidad Católica Boliviana San Pablo Regional La Paz, has to say.

“Over the past few years, I have been using MyABCM to teach cost management to my students. This program has completely transformed the way I present and analyze cost information in the classroom.”
One of the key features of MyABCM is the ability to create customized cost models that simulate real businesses. Professor Alex emphasizes, “I can configure different costing systems, such as job order costing, process costing, and activity-based costing. This allows students to experiment with different costing strategies and understand the financial impact of each decision.”
MyABCM stands out for its intuitive interface and ease of use, even for students with little experience. The Professor emphasizes, “The platform generates automated reports and charts that facilitate the analysis of results. This helps students develop critical thinking skills and interpretation of accounting data.”
In summary, MyABCM has significantly improved the effectiveness of Professor Alex’s classes. He highlights, “It allows students to learn by doing, rather than just reading texts and abstract theories. I would definitely recommend this innovative software to any cost accounting lecturer looking to make their classes more interactive and engaging.”
Professor Alex’s testimonial highlights the transformative impact of MyABCM on cost accounting teaching. By providing a practical and interactive experience, our platform not only simplifies complex concepts but also inspires critical thinking and prepares students for the challenges of the professional world. Together, we are raising the standard of cost management teaching, empowering the next generation of financial professionals.
In the dynamic landscape of education, innovative tools play a crucial role in enhancing teaching. In this article, we delve into the experience of Professor Laura Ghezzi, a Certified Public Accountant with a degree in Administration, who chose MyABCM to enrich her classes on Costing and Activity-Based Management.

Professor Laura Ghezzi shared with us why she chose MyABCM for her classes: “In the Costing and Activity-Based Management course, the professors were already familiar with the MyABCM tool from previous implementations in professional development and its previous academic use. This made it the first choice when thinking about a tool that demonstrates the application of the specific theme of the course.”
One of the main contributions of MyABCM to Professor Ghezzi’s classes is its ability to provide students with a concrete view of the implementation of ABC costing in business practice. “Being able to observe firsthand how the ABC system is implemented in real life is very enriching for students. This allows them to have a concrete idea of its application and the possibilities for subsequent analysis based on the data loaded into the software.”
When asked how MyABCM supports the teaching and learning process, the professor emphasizes: “In the course, we navigate directly through the tool in a case application in one of the classes. In another, we show the different tables and graphs obtained for the analysis of information for decision-making.”
Professor Laura Ghezzi’s experience highlights MyABCM as an essential tool in her cost management teaching process. By providing a practical perspective on ABC costing, MyABCM not only enriches students’ learning but also offers a tangible approach to understanding and applying concepts.
Professor Ghezzi’s commitment to choosing a tool that not only meets academic needs but also has practical application in the professional world positions MyABCM at the forefront of business management education.